

Quick answer: Microsoft Planner shows assignments, not availability. It can tell you that someone is on nine tasks; it cannot tell you whether they have time next quarter, because Planner stores no working calendar, no allocation percentage and no capacity figure. Planner Premium adds a workload view, which helps within a plan but not across a pool of people working on several plans at once. Real resource management needs demand and capacity in the same view — which means holding that data somewhere above the plans.
This is the gap PMOs hit first, usually the week after someone commits to a delivery date.
Assignment is not availability
The distinction sounds pedantic and turns out to be the whole problem.
Assignment is a link between a person and a task. Planner records this well: who owns what, in which bucket, due when.
Availability is how much of that person's time exists to be spent, after their other commitments, their leave, their part-time contract and the two other initiatives they are already on.
Planner holds the first and nothing of the second. So the question a resource manager actually asks — can this person take this on? — has no answer inside the tool, no matter how carefully the plans are maintained.
The practical symptom is familiar. Everything looks fine plan by plan. Then three programs discover in the same week that they are all relying on the same integration specialist, and the discovery happens in a steering meeting rather than in a planning session.
What Planner actually gives you
Being accurate here matters, because the loose version of this argument is easy to dismiss.
Planner Basic
Assignments per task, with the ability to filter a plan by assignee and see a per-person view of that plan. Useful for a team lead running one plan. It answers "what is Priya doing on this plan" and nothing wider.
Planner Premium
Adds a workload view, which is a genuine step up. You can see effort distribution across the people on a plan and spot who is carrying too much of it relative to everyone else.
Two boundaries. It works within a plan, so it compares people against each other on that plan rather than against their total commitments. And it works on task effort rather than on a capacity figure — there is no underlying statement of how many hours a person actually has.
For a single project with a dedicated team, Premium's workload view may be all you need. The moment people are shared across plans, it stops being able to answer the question.
The four questions resource management has to answer
None of these can be answered from task assignments alone.
1. Do we have the people to deliver what we just committed to? Demand by role and skill, across every initiative, against the capacity that exists. This is the question that decides whether a roadmap is a plan or a wish.
2. Who is over-allocated, and by how much? Not "who has a lot of tasks" but "whose committed allocation exceeds their available hours in a given period".
3. What does saying yes to this displace? Every new commitment takes capacity from something. Without a capacity view, that trade-off is invisible until delivery slips somewhere unrelated.
4. Are we actually using the people we have? Utilization against capacity, which is as much about under-use in one team as over-commitment in another.
Why this is harder in Planner than it looks
Three structural reasons, none of which are fixed by working harder at plan hygiene.
Plans are isolated. Each lives in its own group. A person's total commitment is spread across plans that have no knowledge of each other, so no single plan can compute it.
There is no capacity record. No working calendar, no FTE percentage, no statement that a person is available three days a week. Without a denominator, allocation cannot become a percentage and over-allocation cannot be detected.
Task counts are not effort. Nine small tasks and one large one look similar in a card count and are nothing alike in hours. Any capacity view built on task counts will be confidently wrong.
What a working capacity view looks like
Whatever tooling you use, the shape is the same.
- A resource pool with each person's availability recorded — working hours, non-working time, part-time percentages.
- Allocation by initiative, in hours or as a percentage of FTE, over a period rather than as a single number.
- Roles and skills, so demand can be planned before named people are chosen. Most capacity questions arrive months before anyone knows who will do the work.
- A comparison view — allocation against availability, per person and per role, as a table for detail and a histogram for pattern.
- Live delivery data underneath, so the picture reflects what is actually happening in the plans rather than what was assumed at planning time.
That last point is what separates a capacity model from a capacity spreadsheet. A spreadsheet is accurate on the day it is built.
How PPM Express Enterprise handles it
PPM Express sits above Planner and holds the data Planner has no place for, while the plans stay exactly where they are.
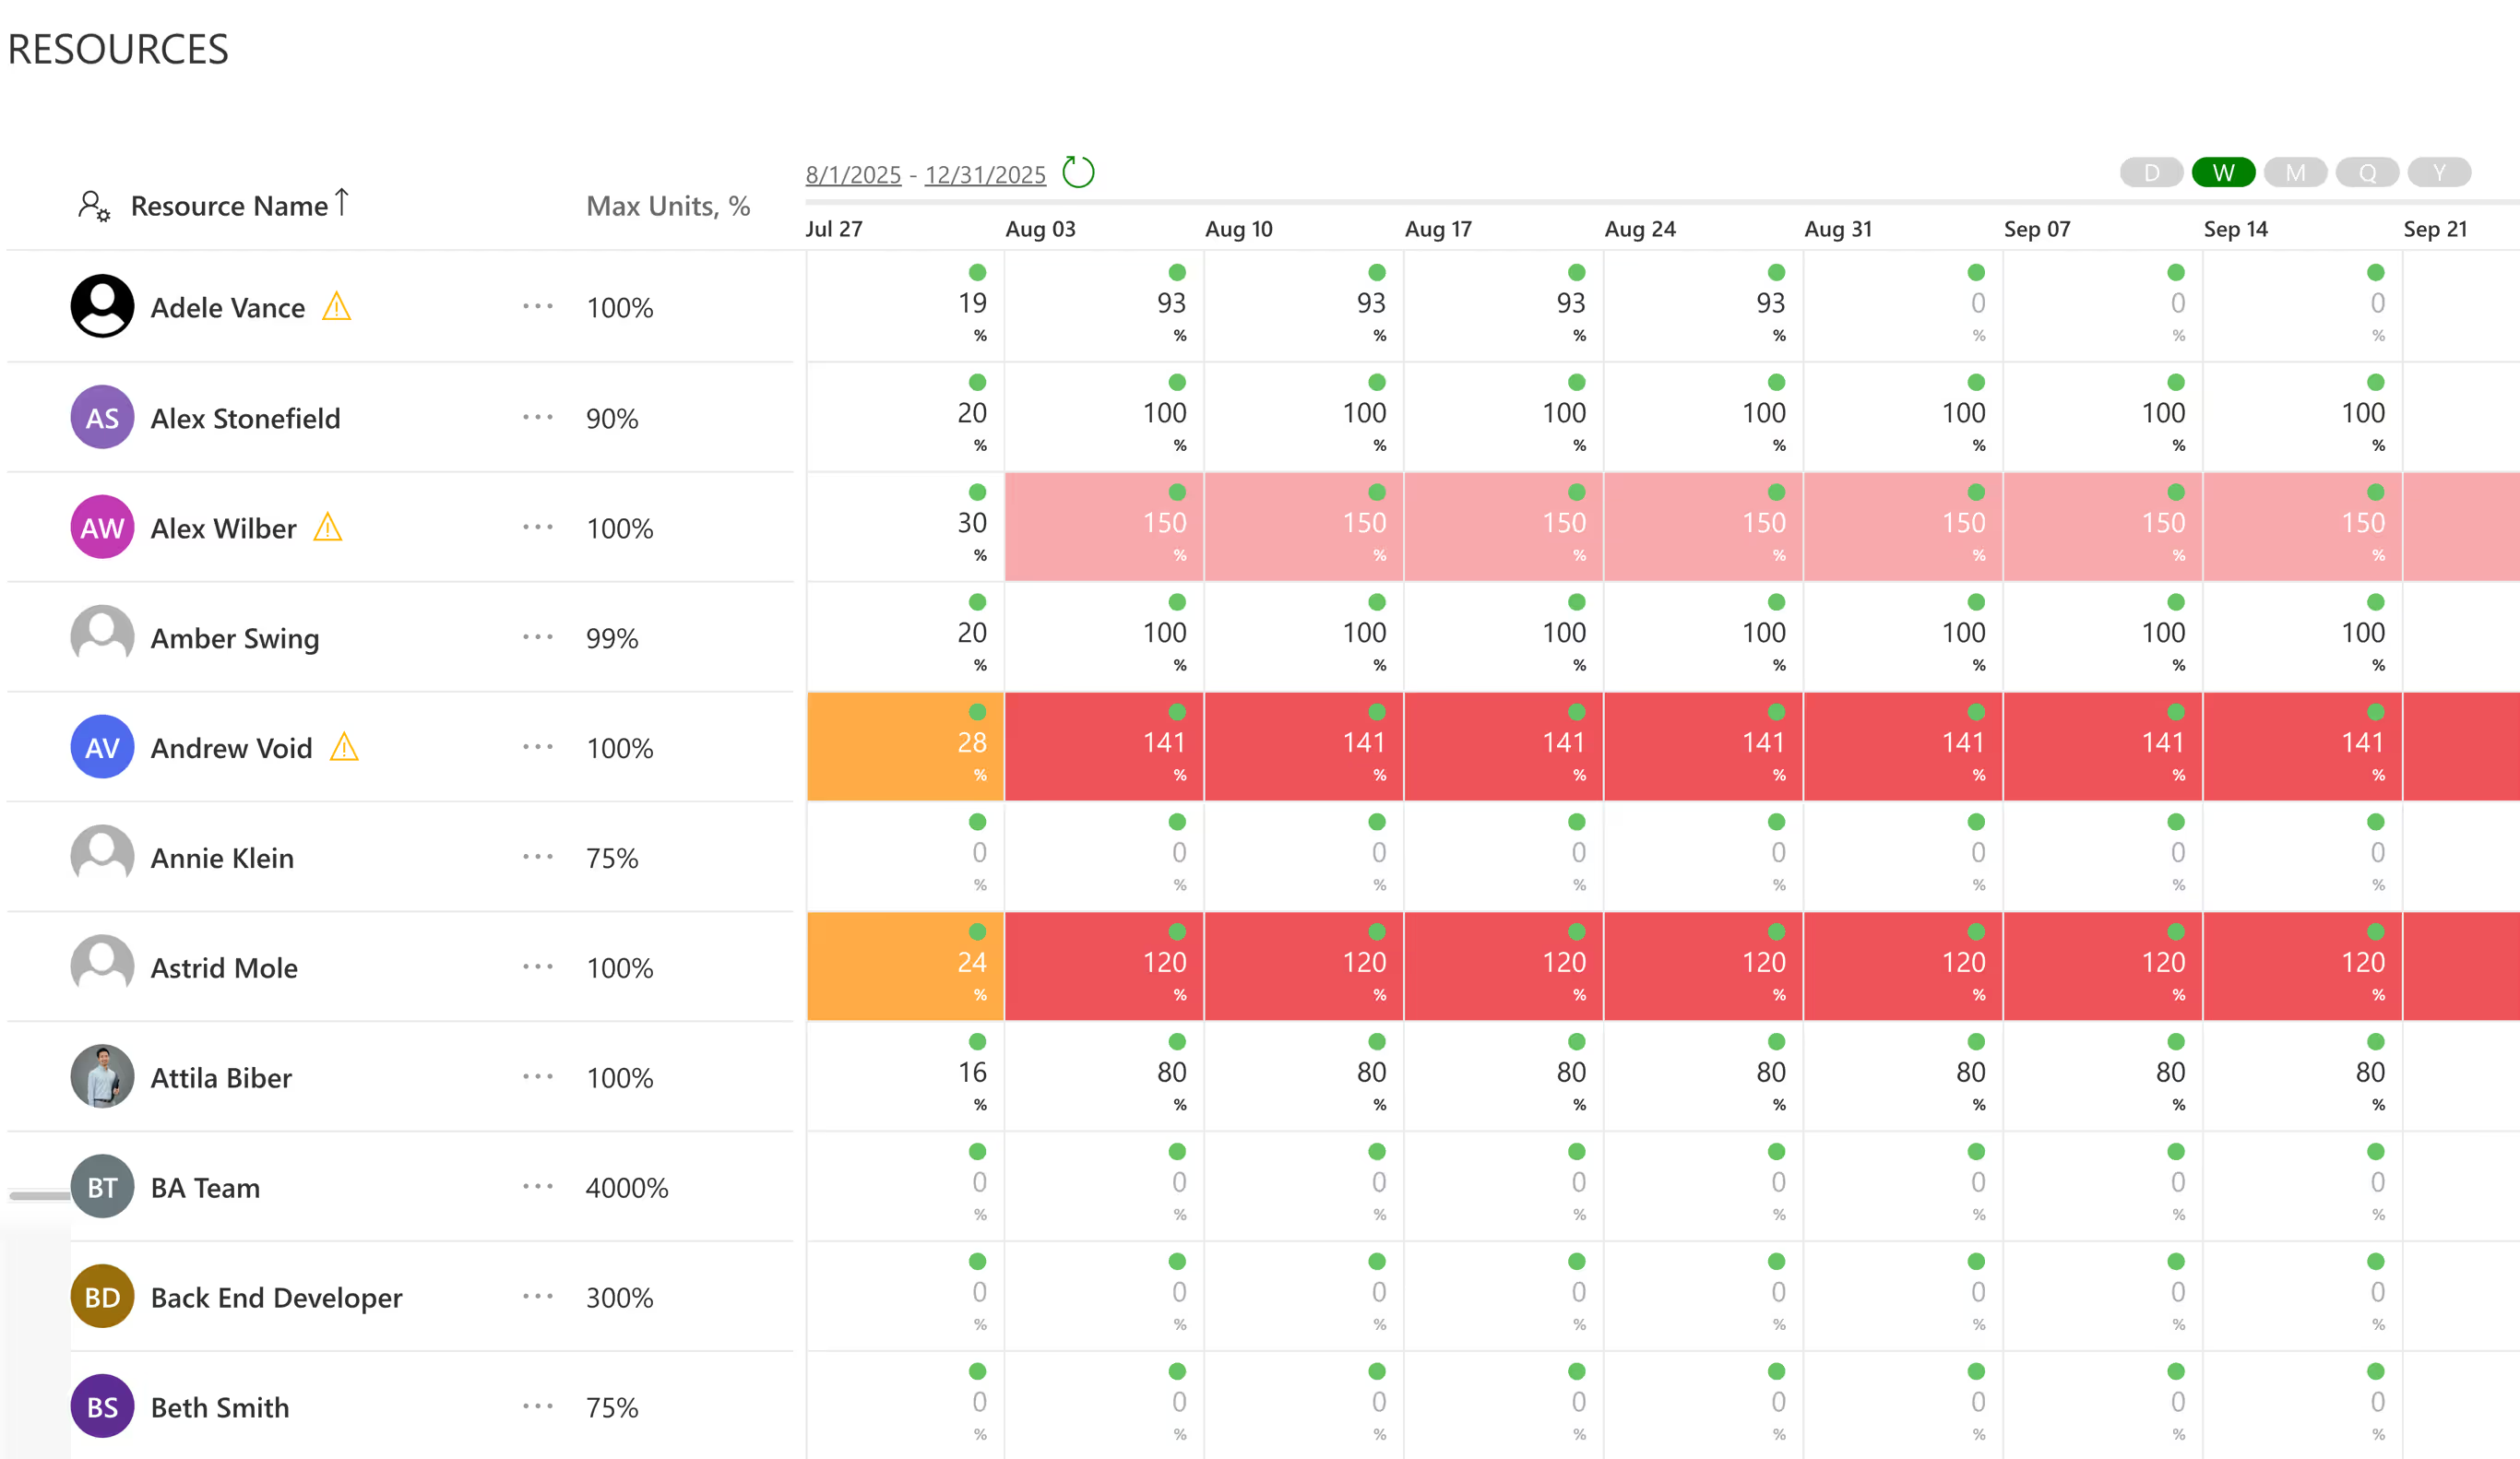
Resource capacity planning works on a pool: each person's availability is recorded, and allocation to initiatives is entered in hours or percentage FTE across periods. Demand can be modelled by role and skill before named people are assigned, which is how most planning conversations actually start.
The pool reads as a table when you need the detail and a histogram when you need the pattern, so over-allocation surfaces as a shape rather than as a number somebody has to notice.
Underneath, the Planner integration reads plans, buckets, tasks, assignments, dates and progress — Basic and Premium — and never writes back. Your teams carry on in Planner and see no change. Jira, Azure DevOps, Microsoft Project, Smartsheet and monday.com feed the same pool, which matters because shared specialists are usually shared across tools as well as across projects.
PPM Express Resource Utilization / Availability /Capacity view
And because capacity sits in the same place as funding, a funding scenario can be tested against it before it is committed rather than after delivery starts slipping.
Frequently asked questions
It has assignments, not resource management. Planner records who owns which task, and Planner Premium adds a workload view showing effort distribution within a plan. Neither stores availability, working calendars or allocation percentages, so neither can tell you whether a person has capacity.
Effort distribution across the people working on a single plan, so you can see who is carrying disproportionately more of it. It compares people against each other on that plan rather than against their total commitments across every plan they are on.
Not natively — plans are isolated inside their own groups and none can see the others. The options are manual consolidation in a spreadsheet, a Power BI build over the Microsoft Graph API, or a portfolio layer that reads all the plans and holds a capacity model above them.
No. There is no capacity or working-calendar field in either edition, which is why allocation cannot be expressed as a percentage and over-allocation cannot be detected automatically.
No. A portfolio layer reads the plans and writes nothing back. Resource managers and the PMO work in the capacity view; the people delivering stay in Planner.
The short version
Planner answers who is assigned. Resource management asks who has time, and that question needs a capacity record Planner does not keep — availability, allocation as a proportion of it, and a view that spans every plan a person appears on. Premium's workload view helps within a plan and stops at its edge. If your people are shared across initiatives, the capacity model has to live above the plans, because no individual plan can see enough to build one.
If the recurring problem is discovering resource conflicts in the steering meeting rather than in planning, that is precisely what a capacity view above Planner is for.
.svg)


