
Every project is funded on a promise about money. Almost no organization ever goes back to check whether the promise was kept — because the spend is tracked in one system and the benefit is tracked nowhere.
Budgets, cost and rate tables, and benefit realization in one place, with forecast, baseline and actual across every portfolio, program and project. Included in both paid plans from $8,000 a year, with unlimited users.


Portfolio governance that cannot tell you whether a funded benefit arrived is not governance. It is bookkeeping with a steering committee attached.
It is also why the next business case gets the same number, with the same confidence, and the same absence of evidence behind it.
Two million in savings, eighteen months, signed off by a committee that believed it.
It lives in the approval deck. Nothing in any system is now watching it.
Finance follows the spend to the penny, because spend has a general ledger. Benefit has no ledger, so nobody follows it.
Complete means the work finished. It does not mean the two million arrived.
Someone finally asks whether it paid off, and the honest answer is that no one can say. The people who would have known have moved on.
A budget in a spreadsheet is a snapshot of a meeting. The moment the plan changes, the spreadsheet is wrong, and nobody can tell you which version is the real one.
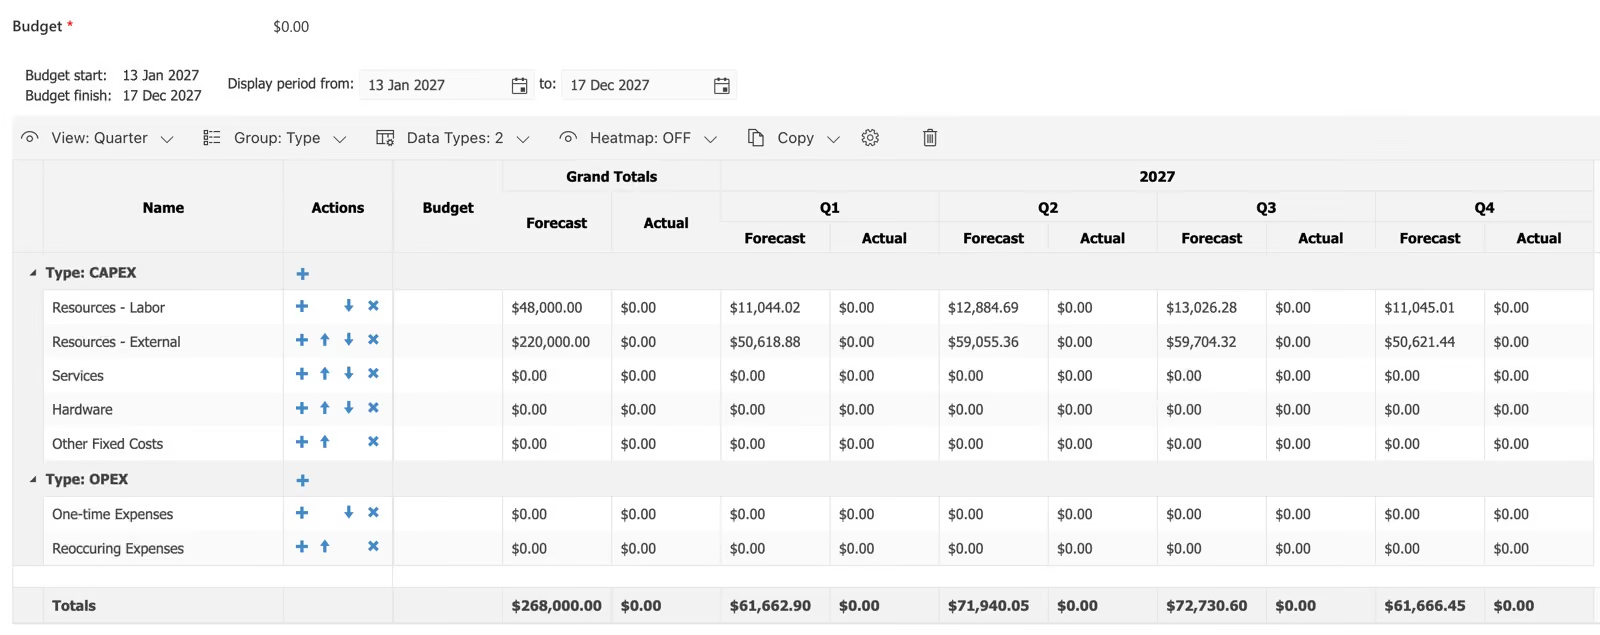
The Financials section creates a separate budget for each portfolio, program and project, so the conversation happens at the level the decision is actually made.
Three distinct time-phased quantities rather than one number that quietly changes meaning. Baseline is what you committed to, forecast is what you now expect, actual is what happened — and forecast can be copied to baseline when a re-plan is formally agreed.
Cost categories carry general ledger codes, so the portfolio view and the finance system are describing the same buckets instead of two taxonomies somebody reconciles by hand every quarter.
Custom fiscal periods, so the numbers land in the periods your finance team reports on rather than in calendar months that match nobody's year end.
Closing a period locks it. Once a quarter has been reported, it stops moving underneath the report — which is the single control that makes portfolio financials trustworthy to a finance function.
The financial grid is where your numbers are recorded: forecast, baseline and actual, entered by the people accountable for them. What makes those numbers comparable across a whole portfolio is that the rates behind them are defined once, centrally, and dated.
Get that wrong and every project is quietly using a different number for the same role, which is how two teams end up presenting incompatible costs for identical work.
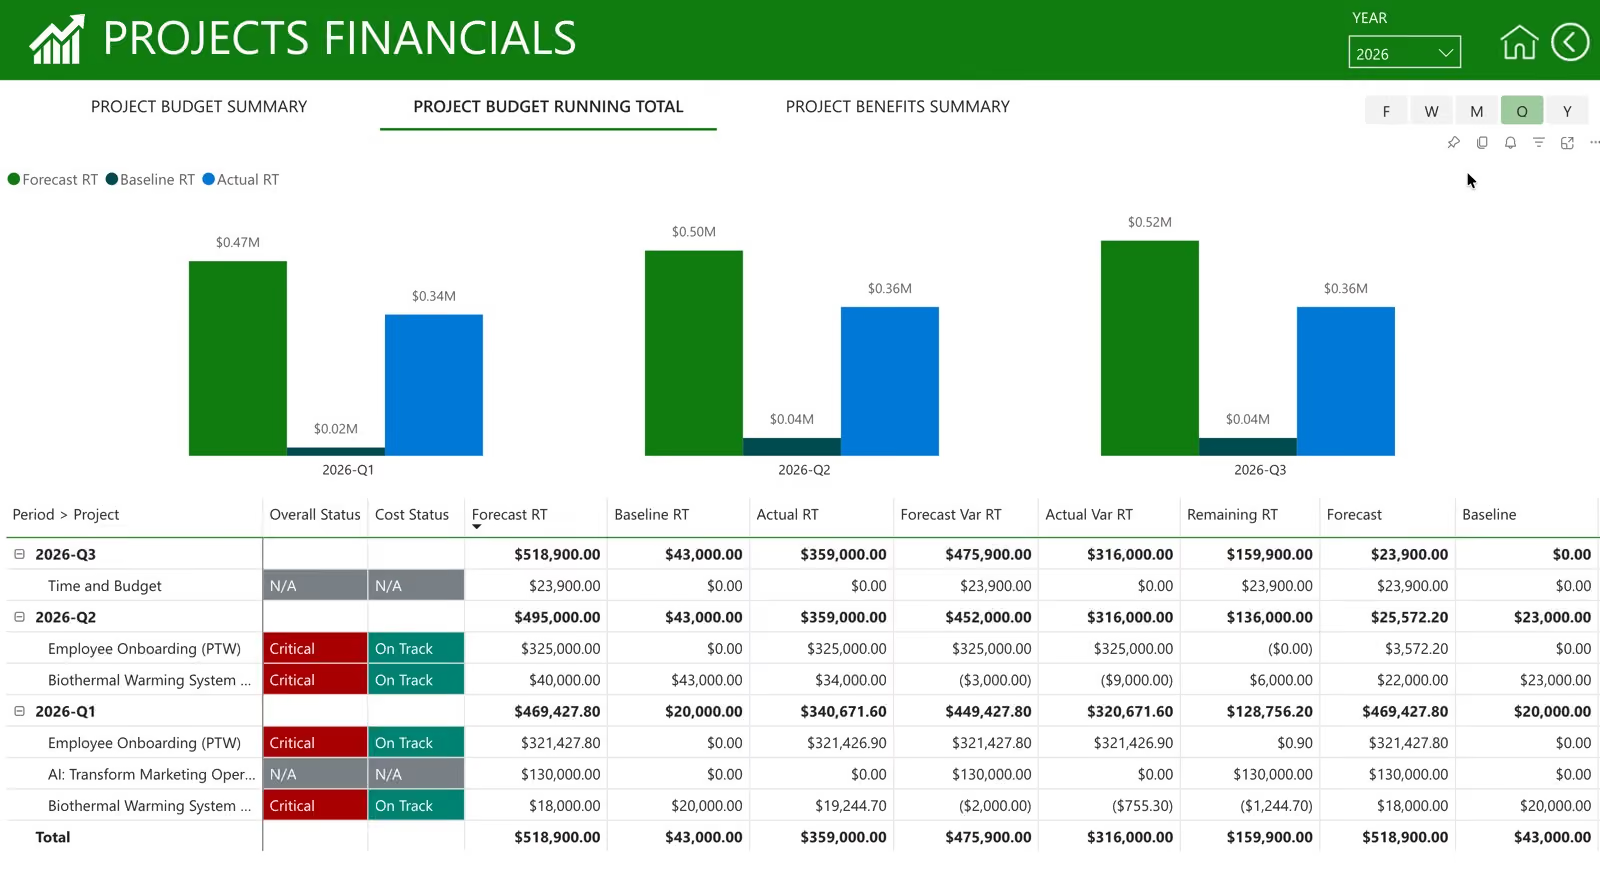
Six rate fields — standard cost, overtime cost, cost per use, standard rate, overtime rate and charge per use — so the difference between what a person costs you and what you charge for them is defined in one place rather than assumed differently by each project manager.
Rates are effective-dated, and the system will not allow gaps between periods. That sounds like a small constraint. It is the reason a three-year programme cannot end up with a stretch of time where nobody can say which rate applied.
Worth being exact, because it is a real architectural line: the grids record what people enter, and the Financials report pack does the calculation. Cost and charge from hours and rates, variance against baseline, estimated margin where you run client-billable work. Entry and calculation stay separate, which is why two people looking at the same portfolio are looking at the same numbers.
Rate configuration sits behind a specific financial permission. People can run projects, and see the budgets they are accountable for, without seeing what each named person costs.
This is the part almost every tool skips, and the reason is structural rather than lazy. Most products give you somewhere to type a benefit and nowhere to track it. A field is not a measurement.
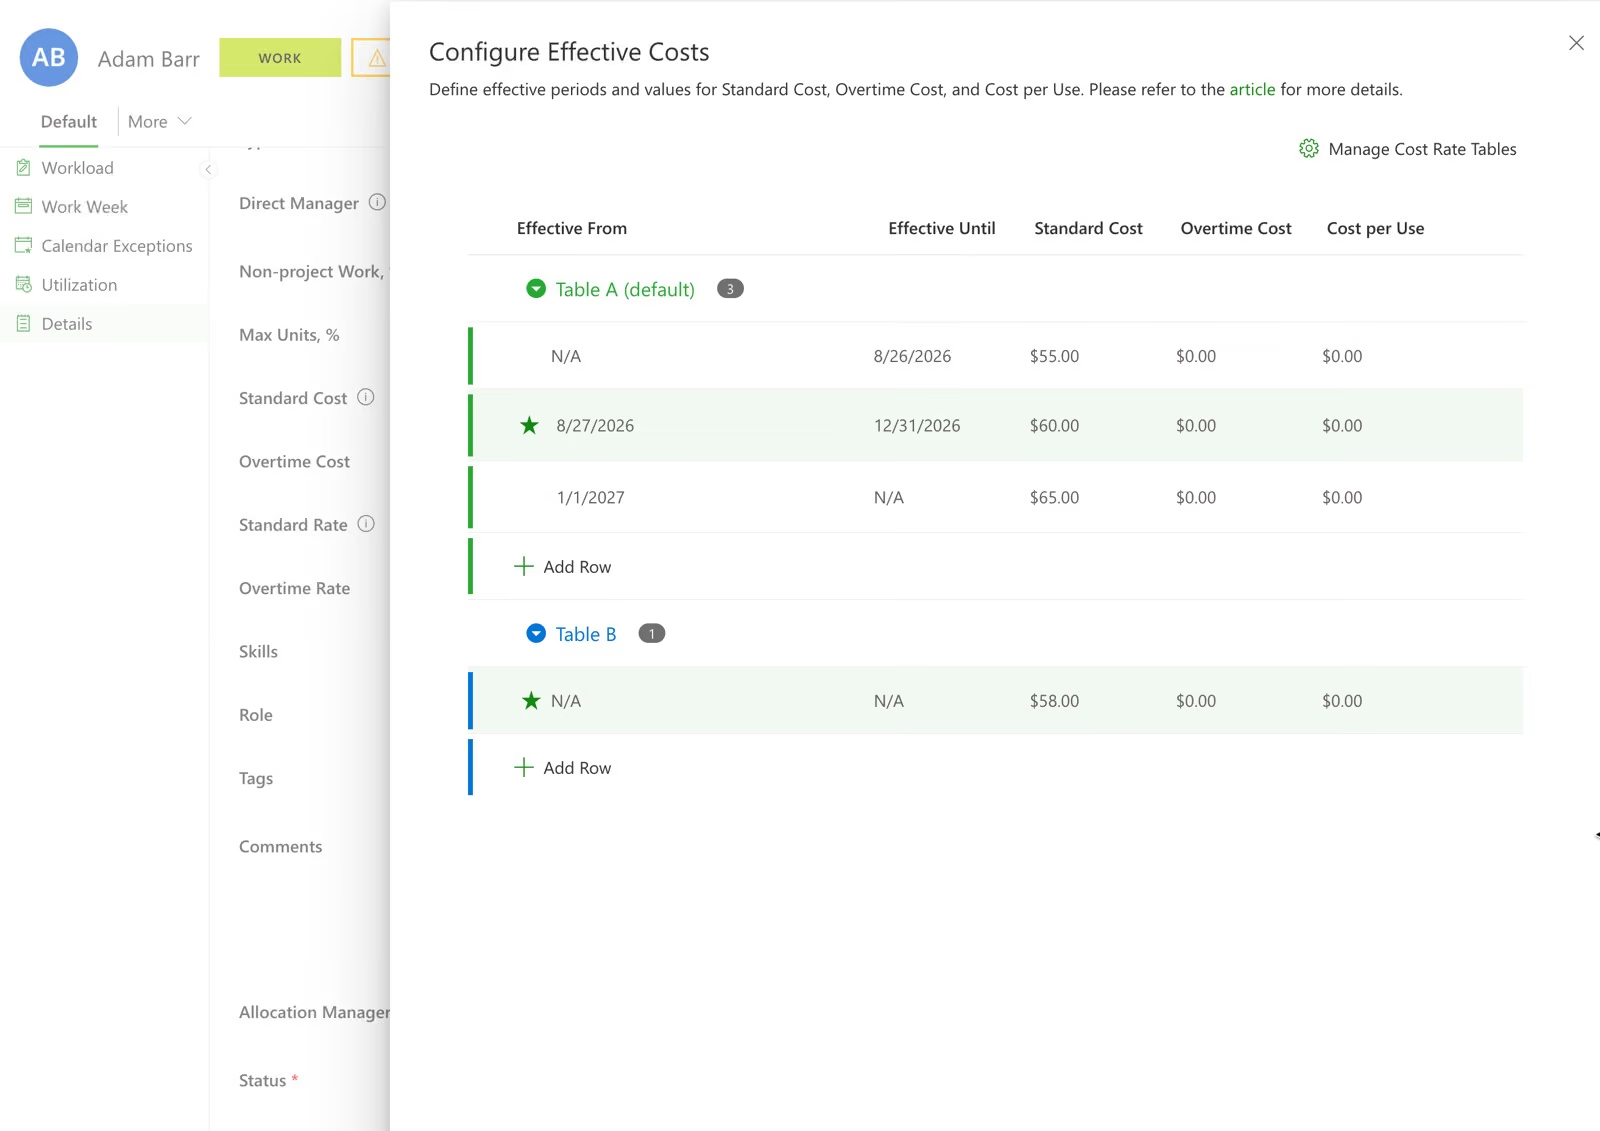
Benefits sit alongside the budget with the identical time-phased forecast, baseline and actual structure. The promise is recorded the same way the spend is, which is the only thing that makes the two comparable.
Benefits can be fiscal or non-fiscal, so the real ones that are not currency — risk reduced, compliance achieved, capacity released — get tracked instead of dropped for not fitting a money column. Non-fiscal benefits stay out of financial totals, so they inform the decision without inflating the return.
A baselined benefit is a commitment on the record. When the forecast moves away from it, that movement is visible — which is the entire point, and precisely what an approval deck in a folder can never do.
Benefit almost never lands on the day a project closes. Because it is time-phased, it keeps being measured into the periods after delivery, which is when the value was always going to show up.
Financial control that lives inside individual projects is not portfolio management. The view that changes decisions is the one above the projects.
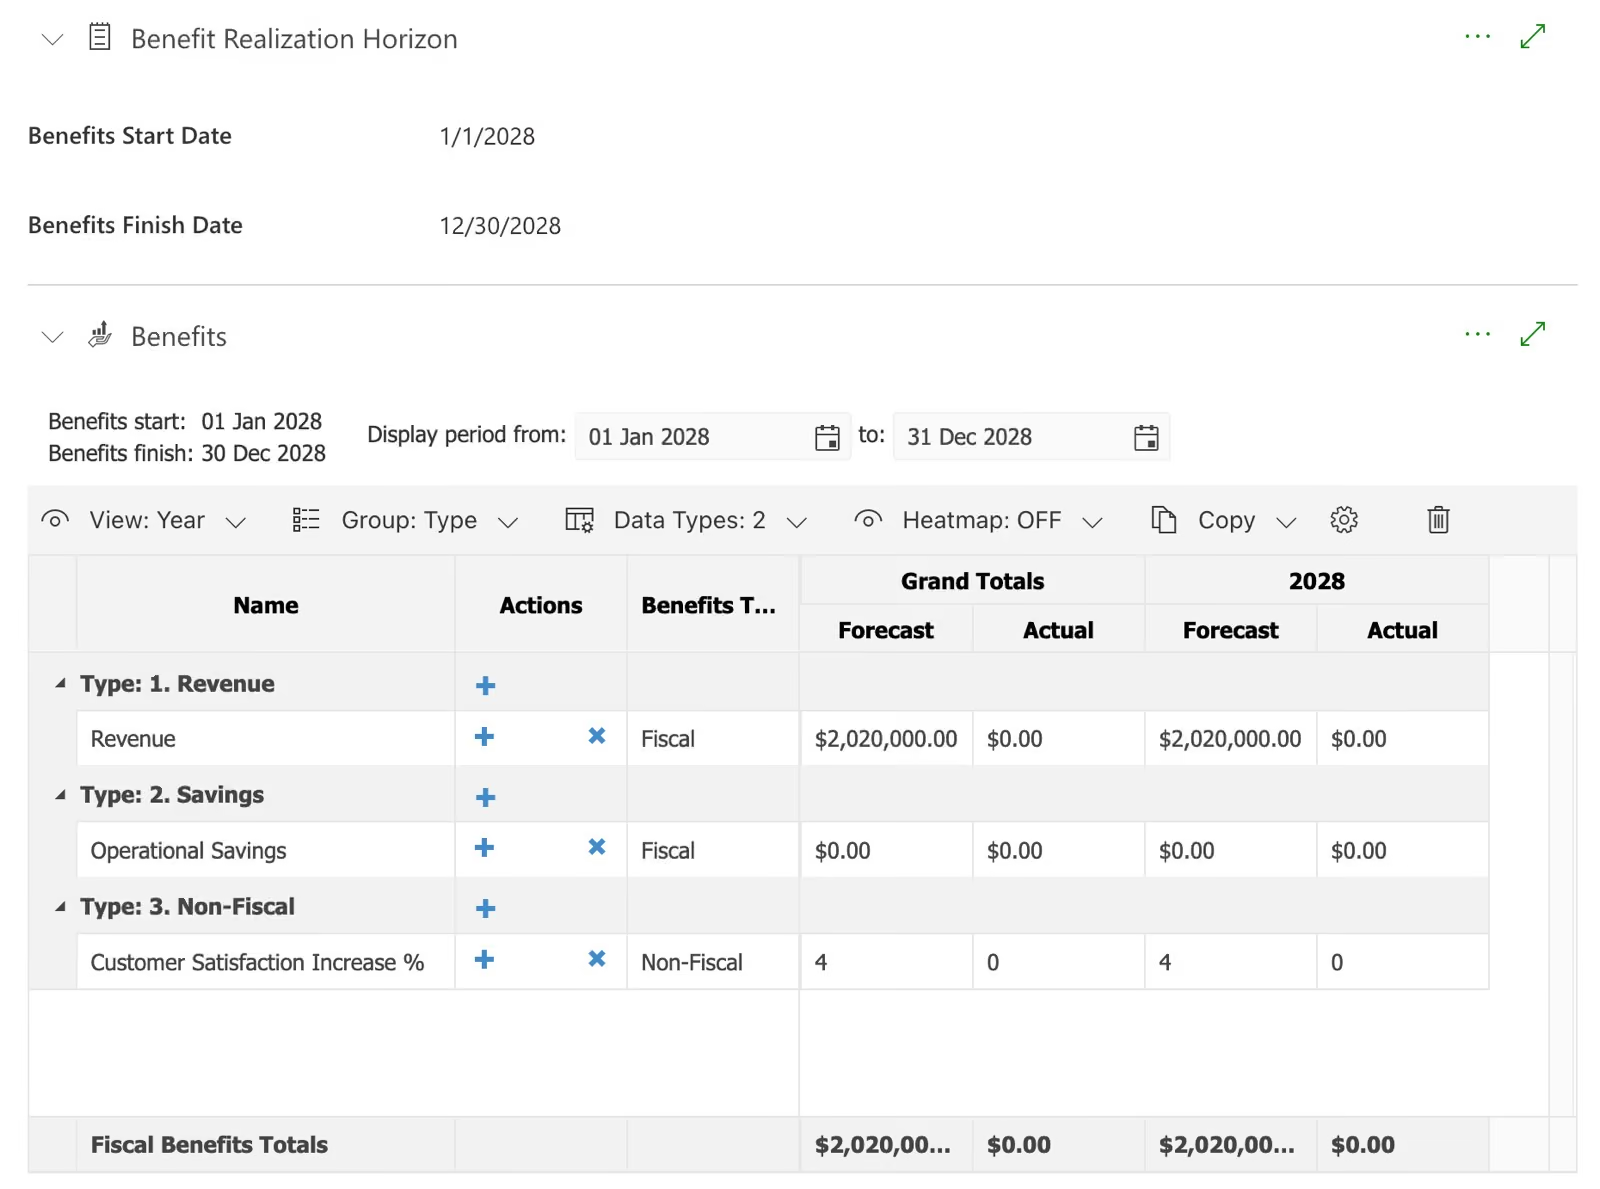
Cost and benefit reporting across projects, programs and portfolios, with budget, baseline, actual, remaining and variance delivered as measures rather than as a modelling exercise for somebody to build.
Worth being precise, because it is a deliberate design decision: a portfolio budget is its own budget, not an automatic sum of the projects beneath it. Roll-up across the hierarchy happens in the reporting layer. That means a portfolio can hold funding not yet allocated to any project — which is how portfolio funding actually works.
The value of forecast against baseline is not the year-end number. It is watching the gap open in month four, while there is still time to do something other than explain it.
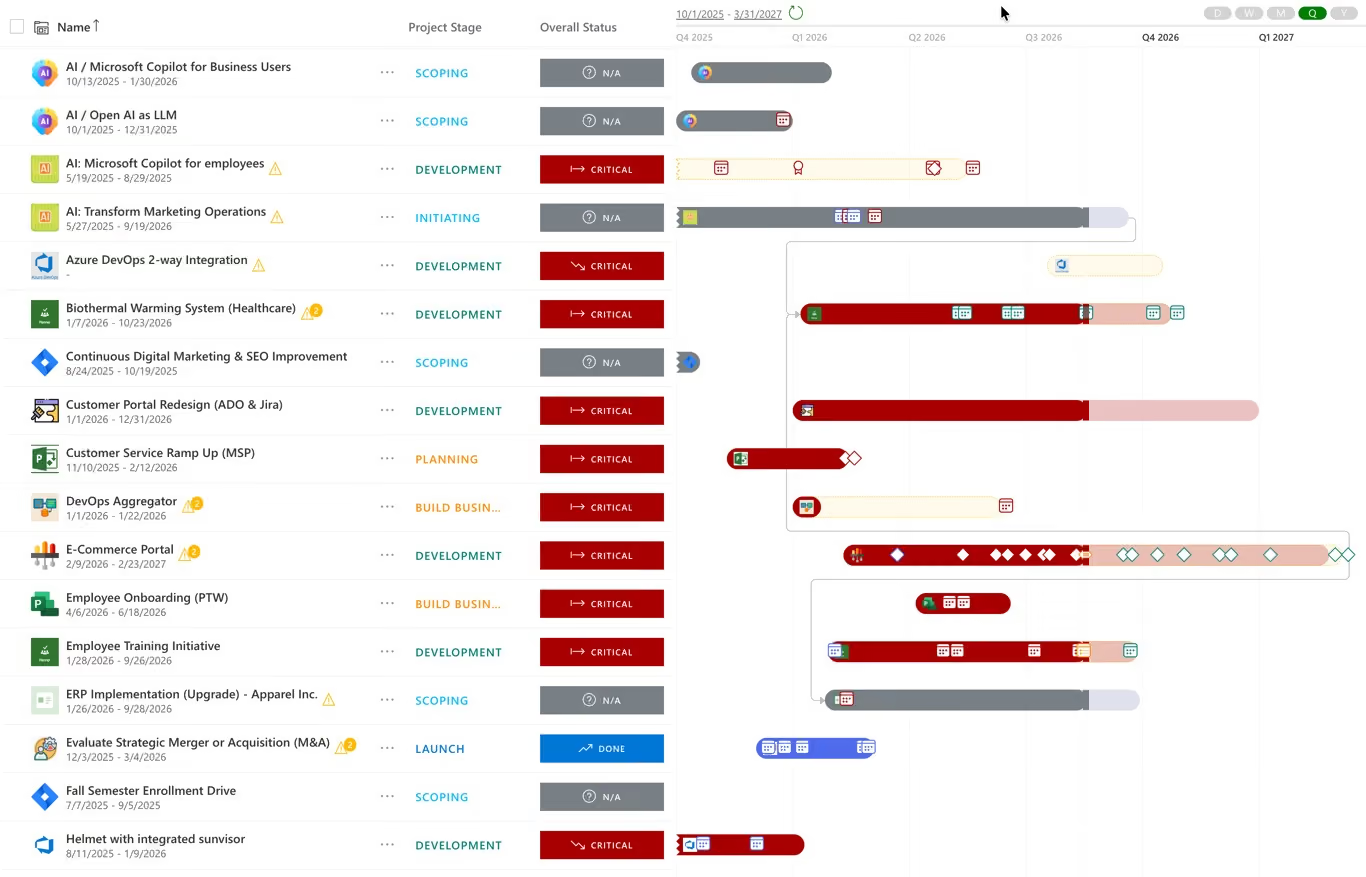
The effects of measuring benefits are mostly cultural, and they start before any benefit is realised.
When people know the benefit they claim will still be measured in two years, the numbers in the approval deck change. This is the largest effect and the least discussed one.
Killing a project is politically expensive when the only evidence is opinion. It is straightforward when a benefit forecast has visibly detached from its baseline for three consecutive periods.
After a few cycles you know which kinds of initiative actually deliver what they promised in your organization, which is worth more to the next funding round than any estimating methodology.
Worth knowing before you start: PPM Express financials operate in a single currency across the tenant. For a multinational consolidating across currencies, that is a real constraint and you should raise it with us early rather than meet it during configuration.
Return on investment is reported. Net present value, internal rate of return and payback period are not. Organizations that need formal investment appraisal generally do it in finance's own models and use PPM Express to track whether the benefits those models assumed actually arrive.
Benefit realization is the capability that separates portfolio management from project administration, and the market splits cleanly on it.
Every figure below comes from the vendor's own pricing or documentation pages. Where a vendor publishes no price, this page says so rather than estimating one.
Planview, Broadcom Clarity and ServiceNow SPM all document real benefit realization. Clarity tracks planned benefit, actual benefit and variance per period. None of the three publishes a price at all.
Celoxis puts costing in Professional at $35 per user per month. OnePlan puts the financial plan in Professional at $30. Wrike's cost and bill rate fields are Pinnacle and Apex only. Asana sells budgets as a paid add-on. None of them documents benefit realization at all.
A $30 per-user financial module is $90,000 a year on top of whatever the platform costs, and at that tier it buys budgets without benefits.
Financials and benefit realization are in the PPM Express Enterprise plan at $8,000 a year, with unlimited users, and in Ultra at $25,000. Roughly a tenth of the price for strictly more capability — and the comparison holds without needing anyone to be bad at their job.


Budgets, cost and rate tables, benefits, currency, and which plan it is in.
Both, and benefits are tracked the same way budgets are: a time-phased grid of forecast, baseline and actual, rather than a text field somebody fills in once. Benefits can be fiscal or non-fiscal, so outcomes like risk reduction or released capacity are measured without inflating the financial totals. This matters because it is the capability most tools in this category do not have at all.
Both paid plans. Budgets, benefit realization, cost tables and rate tables are in Enterprise at $8,000 a year as well as in Ultra at $25,000, with unlimited users on either. You do not have to move up a tier to put portfolio financials in place, which is the opposite of how most of this category is packaged.
The Financials section creates a separate budget for each portfolio, program and project, with forecast, baseline and actual as three distinct quantities. Cost categories carry general ledger codes so the portfolio view lines up with your finance system, periods follow your fiscal calendar rather than calendar months, and closed periods lock so a reported quarter stops moving underneath the report.
In the Financials report pack, not inside the grid. The grids are where figures are recorded — forecast, baseline and actual, entered by the people accountable for them. Cost rate tables hold standard cost, overtime cost, cost per use, standard rate, overtime rate and charge per use, and the Financials reports derive cost and charge from committed hours and completed work against the resource rate. Rates are effective-dated and the system does not permit gaps between rate periods, so cost reporting across a multi-year programme cannot fall through a hole in the rate history.
Yes. Cost rates and charge rates are separate fields on the rate table, which is what makes estimated margin possible in the Financials reports for organizations running client-billable work. The same underlying rate data feeds an internal cost view and a delivery margin view without anyone maintaining two models.
Not automatically, and that is deliberate. A portfolio holds its own budget, because portfolio funding often exists before it has been allocated to any specific project. Roll-up across the hierarchy is available through the Power BI reporting layer, so you get the consolidated view without forcing every pound of portfolio funding to be pre-assigned to a project that may not exist yet.
No. Financials operate in a single currency across the tenant. If you need to consolidate reporting across several currencies inside the tool, that is a genuine constraint and worth raising with us early in an evaluation rather than discovering it during configuration.
Return on investment is reported in the Financials report pack. Discounted cash flow appraisal, meaning net present value, internal rate of return and payback period, is not. Organizations that need formal investment appraisal typically do it in finance's own models and use PPM Express to track whether the benefits those models assumed actually arrive.
Rate configuration sits behind a specific financial permission rather than being open to anyone with a project login, which matters because resource cost rates are usually derived from salary data. People can work on projects, and see the budgets they are responsible for, without seeing what each named person costs.
.svg)


