

Portfolio data has always been messier than the dashboards suggest. Everyone in a PMO knows this. It was survivable, because the people reading the data knew where the soft spots were and adjusted quietly as they went.
An agent adjusts only for what it can see. It reads what's there, at speed, across everything, and produces an answer with no visible seam between the parts that were reliable and the parts that weren't, unless something in the data marked the difference.
That's the shift. Data quality moved from a hygiene concern that someone would get around to, into a governance concern that determines whether your AI layer is useful or actively misleading. Same underlying data. Much higher consequences.
Why does data quality matter more with AI agents?
Because AI can only reason over the data, context, controls and metadata it can access, and portfolio data carries a large amount of correction that has never been written down. A human reader discounts an over-cautious RAG status or a lagging finance feed automatically. An agent can only do the same if provenance, confidence, definitions and history exist as data. Where they don't, the analysis is produced at full fluency regardless, and nothing in the output signals which inputs were weak.
Humans used to do the discounting silently
Watch an experienced portfolio manager read a status report. They're doing a lot of unlogged work.
One programme manager marks everything amber as a hedging strategy; another only goes amber when something is properly on fire. The reader adjusts for both without noticing they've done it. Finance lags by six weeks, so a project showing 30% spend at the halfway point is probably fine. “80% complete” from a particular team has meant “we've started the hard part” for three years running. And two of the source systems disagree about what counts as a milestone; our reader knows which one to believe, and roughly why.
None of that is written down anywhere. It lives in the heads of maybe four people, and it's the reason the reporting works at all.
This is the part that catches organizations out, and it's worth stating precisely rather than dramatically. An agent is not incapable of that kind of correction: given provenance, confidence scores, data-quality rules, source metadata and historical context, a model can weight inputs differently and flag the ones it distrusts. The problem is that in most portfolios none of that exists in a form anything can read. The corrections live as tacit organizational knowledge, and what has never been encoded cannot be applied. So the agent treats a number as a number, and produces analysis that reads as though every input were equally reliable.
The tacit corrections were load-bearing. Automating the reading without encoding them removes a control nobody realized existed.
Five ways portfolio data is quietly wrong
Not corrupt. Just not what it appears to be.
Progress is self-reported and socially shaped. Percent complete is an estimate made by someone with a stake in how it lands. Not dishonesty, mostly: genuine optimism, plus a sense of what the steering committee wants to hear. Aggregate a few hundred of those and you get a portfolio position that's directionally optimistic in a way no single entry would justify.
Categorization drifts across tools and teams. What one team logs as a risk, another logs as an issue. A “milestone” in one delivery tool is a “key date” in another and a task with a flag in a third. Roll those up and the counts are arithmetically correct and semantically meaningless.
Financial data lives on a different clock. Commitments, accruals and actuals arrive at different times through different systems. Compare spend against progress at any given moment and you're comparing two things measured weeks apart. Most variance analysis quietly rests on this mismatch.
Resource assignment is planned, rarely reconciled. The allocation says a person is on three projects at 40%, 40% and 30%. Where did they actually spend last month? Without timesheet actuals feeding back, capacity reporting describes an organization that exists only in the plan.
Definitions drift over time within the same field. The RAG criteria changed when the new PMO lead arrived in 2024. Nobody restated the historical data. So a trend line crossing that boundary compares two different measurements wearing the same label, and looks perfectly smooth doing it.
All of this is normal, and none of it stops a competent human, who has been quietly compensating for years. To a model, each one is invisible unless the data says otherwise.
Fluency is not accuracy, and it looks like accuracy
Here's the uncomfortable mechanic. The quality of the writing an AI produces tells you almost nothing about the quality of the data it read.
Feed a model a clean, complete, well-governed portfolio dataset and it will produce a clear, well-structured analysis. Feed it a partial, stale, inconsistently categorized one and it will produce a clear, well-structured analysis. Same register, same confidence, same tidy headings. The difference lives entirely in whether the content is true, and nothing on the surface distinguishes the two cases.
Which reverses something reporting professionals have relied on for decades. Bad data used to announce itself: ugly spreadsheets, obvious gaps, columns that didn't add up, an apologetic footnote. Presentation carried a signal about the quality underneath, and experienced readers used it.
That signal is gone. Presentation is now uniformly excellent, which means it carries no information at all about what's underneath.
The practical implication for a PMO: the check has to move upstream. You can no longer assess reliability by reading the output. You assess it by knowing what the system could see and how good that source was, which means data quality is no longer an IT hygiene project. It's the precondition for trusting anything the AI layer produces.
Most portfolio numbers are constructed, not measured
This gets glossed over so constantly that it's worth being blunt.
A room temperature is measured. A project's percent complete is constructed. So is earned value, which depends entirely on how the baseline was set and what method was chosen. So is a RAG status, which is a judgment expressed as a colour. So is a confidence percentage, which is frequently an opinion converted into a number so it can go in a table.
None of that makes them useless. They're often the best available instrument, and portfolio management would be impossible without them. But a constructed number carries the assumptions of its construction, and those assumptions travel silently.
When a model reports that portfolio confidence has declined from 78% to 71%, it's reporting a change in an aggregation of judgments made under criteria that may or may not have been consistently applied. The seven-point drop looks like a measurement. It isn't one.
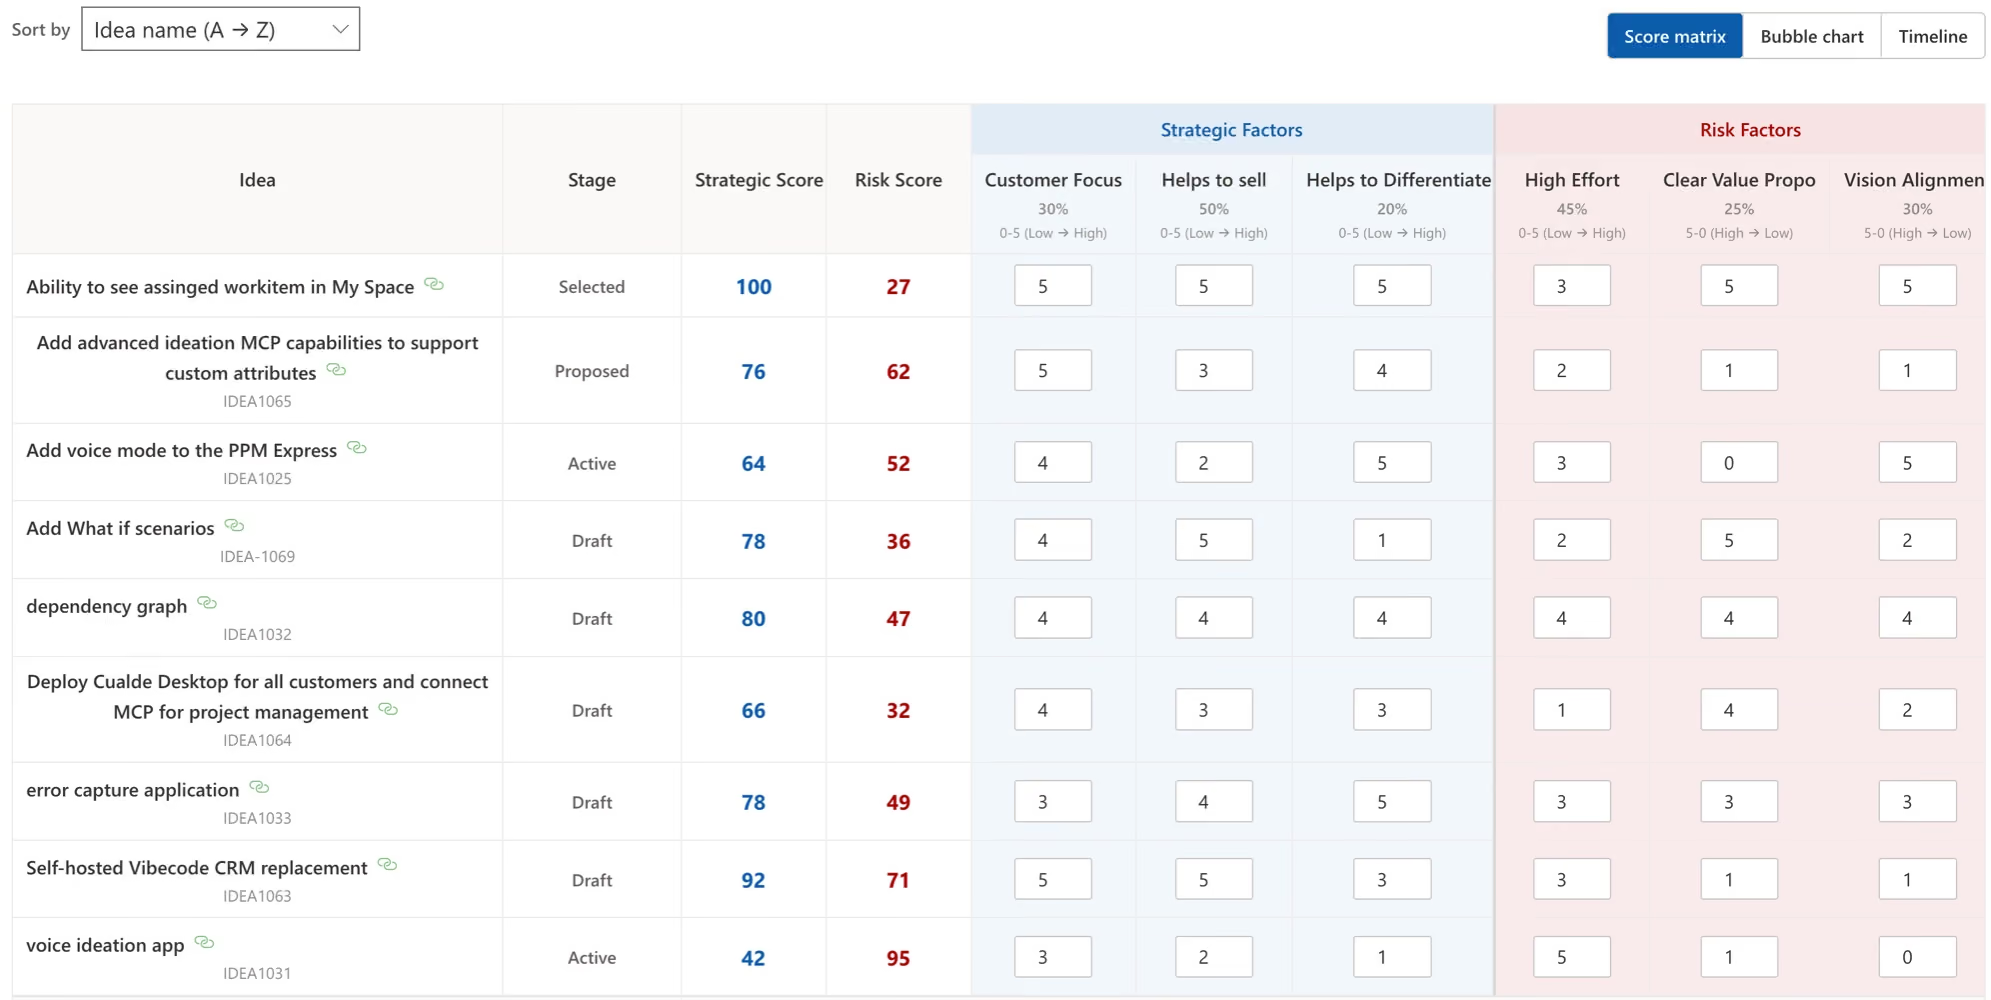
A ranking is only as meaningful as the model that produced it. Keeping the criteria visible next to the result (as idea prioritization and ranking does) is how a constructed number stays honest about being constructed.
Two cheap habits help. Know which of your headline metrics are measured and which are constructed. Many PMOs have never written that list down, and writing it down is clarifying in a slightly uncomfortable way. Then keep the construction rules alongside the data, so that anyone reading it, human or otherwise, can see how the number was built rather than inferring a precision it never had.
Agents raise the stakes on all of it
Everything above was already true of AI-generated reports. Agents change the exposure in a few ways that compound.
The obvious one is speed. Analysis that used to take an analyst a week now lands in seconds, which means it lands before anyone has thought about whether to trust it. That natural friction (the delay in which someone might have noticed the figures looked odd) has quietly gone.
Then scale. An agent reads the whole portfolio rather than the six projects a human had time for, and that's genuinely the point of the thing. But that scale means one systematic data problem now propagates into every conclusion instead of into one analyst's spreadsheet.
The change that actually matters is action. A report is only a claim; somebody still has to decide to act on it. An agent that can update a record, advance a stage or reassign work converts a data quality problem straight into a state change. Your error stops being something a reviewer might catch and becomes something you have to unwind.
Which is why the read/write distinction now carries far more weight than it used to. An agent reading bad data gives bad advice, and advice can be turned down. An agent acting on bad data manufactures bad facts.
Correlation at portfolio scale
Portfolio datasets are fertile ground for false patterns. They tend to be wide, short on observations, and full of variables that move together for structural reasons rather than causal ones.
An analysis finds that projects using a particular delivery method finish closer to schedule. Plausible. It's also entirely possible that the method is preferred by the more experienced programme managers, who are assigned to the better-scoped work, which was better-scoped because it had a stronger business case. The method may be doing nothing at all.
Or: initiatives with senior sponsors show higher benefit realization. Maybe sponsorship helps. Or maybe senior sponsors gravitate toward initiatives that already looked likely to succeed, in which case you have measured selection rather than governance.
Models are very good at surfacing these relationships and not reliably good at distinguishing a mechanism from a coincidence. The output rarely says “these two things move together for reasons I cannot determine.” It's more likely to phrase the association in causal language, because that's how the training data phrases things.
The discipline is old and still works: before acting on a relationship, ask what the mechanism would be, and ask what else would have to be true. If nobody can articulate the mechanism, you have a hypothesis worth investigating rather than a finding worth acting on.
What an AI-ready portfolio dataset actually requires
Less about cleanliness than about structure, and the properties below are roughly ordered by how much difference each one makes.
Coverage. The dataset spans the whole portfolio, not the projects that happen to live in one tool. Of everything on this list, partial coverage hides best: an analysis of a third of the portfolio reads exactly like an analysis of all of it.
Normalized definitions. A milestone means one thing across the portfolio; so does a risk. Where source tools disagree, the mapping is explicit and applied centrally rather than resolved differently by whoever happened to build each report.
Actuals, not just plans. Time logged against work, flowing into utilization and cost. Without it every capacity conclusion is a statement about intentions.
Governance structure held as data. Objectives, investment categories, scoring criteria, stage gates, benefits definitions: stored as structured records rather than as context in someone's head. This is the property that lets a model reason about whether something matters, rather than only whether it's late, and it's the one most often missing.
Provenance. Every figure traceable back to its source record. Not a nice-to-have: it's the only practical way to check an AI claim short of redoing the analysis yourself. It is also what makes the tacit corrections above encodable: a figure that carries its source, its age and its definition gives a model something to weight.
Currency. Live, or with the lag stated plainly. Analyzing last quarter's snapshot as though it were today's is among the easier routes to a confidently wrong conclusion.
None of that is an AI feature. It's portfolio management fundamentals, which happen to have become load-bearing in a way they weren't five years ago.
How PPM Express approaches it
The design assumption is that AI is only as good as the portfolio layer underneath it, so most of the work went into that layer.
Coverage comes from aggregation. PPM Express pulls projects from Azure DevOps, Jira, Microsoft Project, Microsoft Planner, Project Online, Smartsheet and monday.com into one live portfolio on a continuous synchronization rather than periodic manual exports. Synchronization direction varies by connector and plan (some are two-way, others read into the portfolio only), so check the integrations table for the direction and scope that apply to the systems you actually run. Teams keep working where they work. The portfolio view stays complete without anyone migrating anything, which is what makes whole-portfolio analysis possible in the first place.
Structure comes from the governance layer. Objectives, investment categories, weighted scoring models, stage gates, business cases and benefits definitions live in the system as structured records. Strategic portfolio management is where that structure is defined, and it gives an analysis something to reason against beyond dates and percentages.
Actuals come from timesheets. Time logged against projects feeds utilization and cost directly, without a separate system to reconcile. Capacity by role and skill is then built on what happened rather than what was planned.
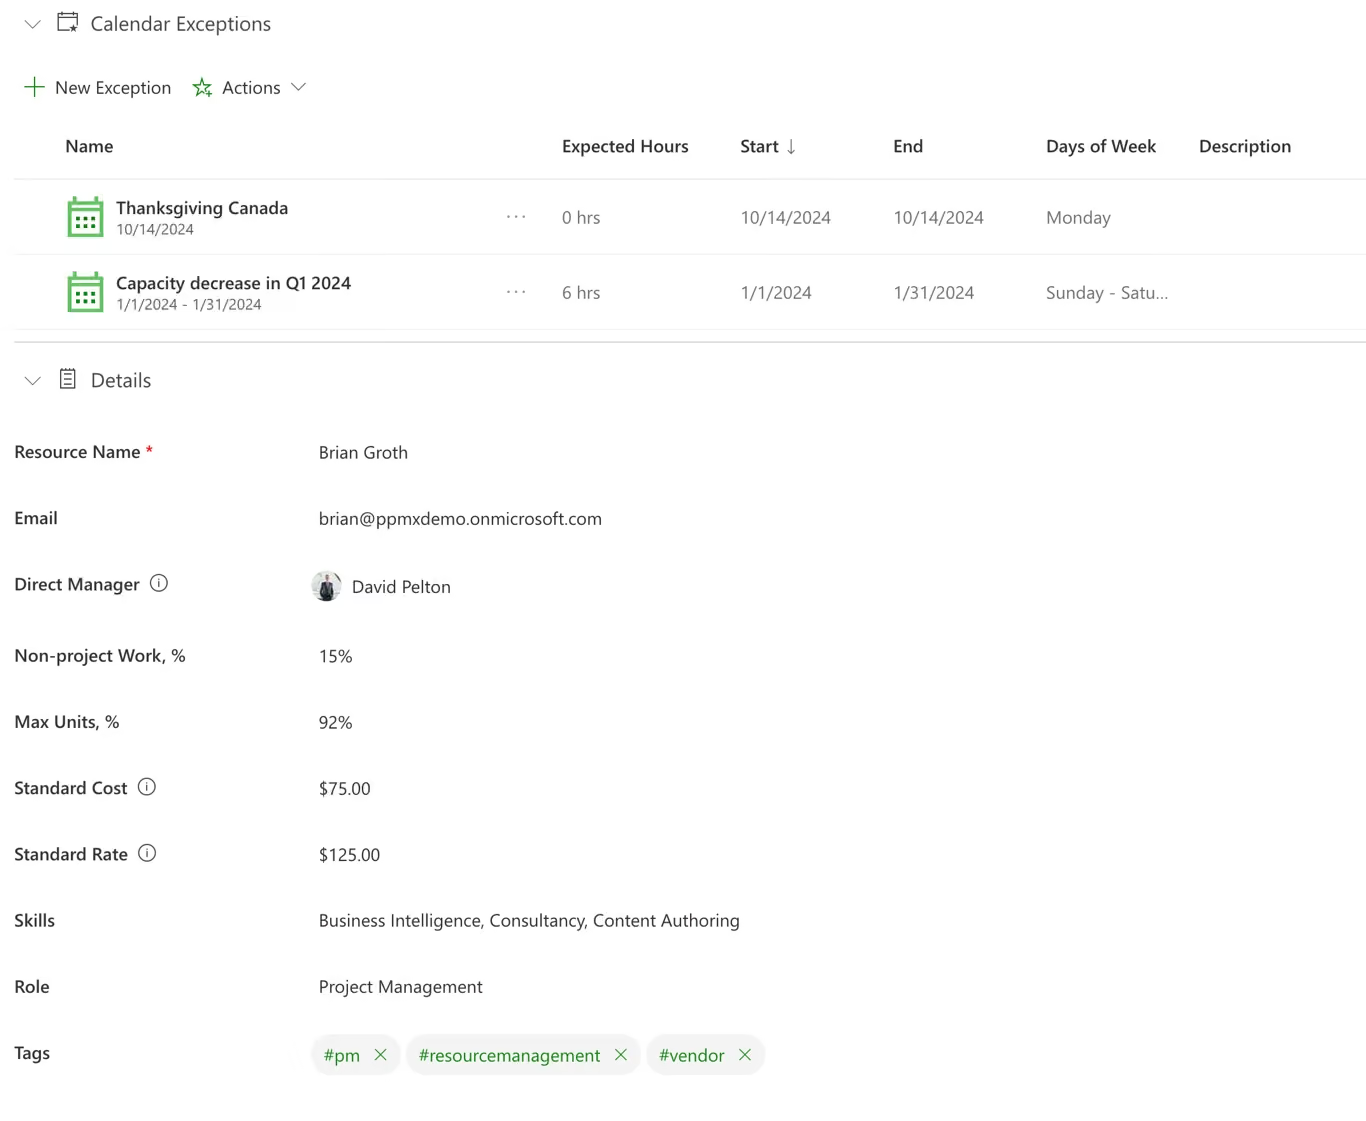
Allocation and actuals in one record. This is the difference between capacity reporting that describes your organization and capacity reporting that describes the plan.
Provenance comes through the MCP servers. When an assistant like Microsoft 365 Copilot, Claude or ChatGPT queries PPM Express over MCP, it does not get a blob of text to paraphrase. It gets records (a project, a task, an idea, a resource, a summary view) and those records come back carrying their own links into PPM Express. So a claim in a summary has an address. If the assistant says three initiatives are drifting, you open all three and look, rather than deciding how much to trust the sentence.
That is the practical answer to the fluency problem set out above. Traceability does nothing to make an analysis correct. What it does is make the analysis checkable, and checkable is the property a governance forum actually needs. A finding nobody can verify shouldn't carry weight in a room where money moves, however well it reads.
AI agents, on the PPM AI plan, monitor continuously and propose corrections rather than executing them. New risks, issues, action items and schedule changes are put forward for a project manager to approve or reject. Given how directly agents turn data problems into state changes, that boundary is a design decision rather than an abundance of caution.
A practice checklist
Things worth doing before you trust an agent with portfolio analysis.
- List which headline metrics are measured and which are constructed. Many PMOs have never done this. It takes an afternoon and changes how the numbers get read.
- Encode the tacit corrections. The four people who know which teams over-report and which systems lag: get it out of their heads and into the data model or the documentation, as source metadata, confidence flags or stated definitions. An agent can act on a correction that exists as data. It cannot act on one that exists as folklore. This is the highest-value hour in the list.
- Establish coverage before trusting any analysis. For every AI output, be able to state what it could see. Treat partial coverage as a defect, not a caveat.
- Normalize definitions across source tools, explicitly. Decide what a milestone is. Apply it once, centrally, rather than differently in each report.
- Connect actuals. Capacity conclusions built on plans alone are forecasts about a fictional organization.
- Require traceability. No figure in a governance pack without a path back to its source record. If a claim cannot be traced, it should not carry weight in the room.
- Separate read from write, deliberately. Agents that analyze and agents that change state are different governance objects. Keep the second category small, ruled, and approved by a human.
Model capability is the part of this that will commoditize. It is improving fast, it is improving everywhere at once, and any advantage a vendor claims there has a short shelf life. The durable difference sits somewhere much duller: portfolio data that is complete, consistently defined, current, and traceable back to a record somebody can open.
Which was always the hard part, long before agents turned up. It also happens to decide whether the answer is worth having.
.svg)


