
PPM for Life Sciences and Pharmaceutical Organizations
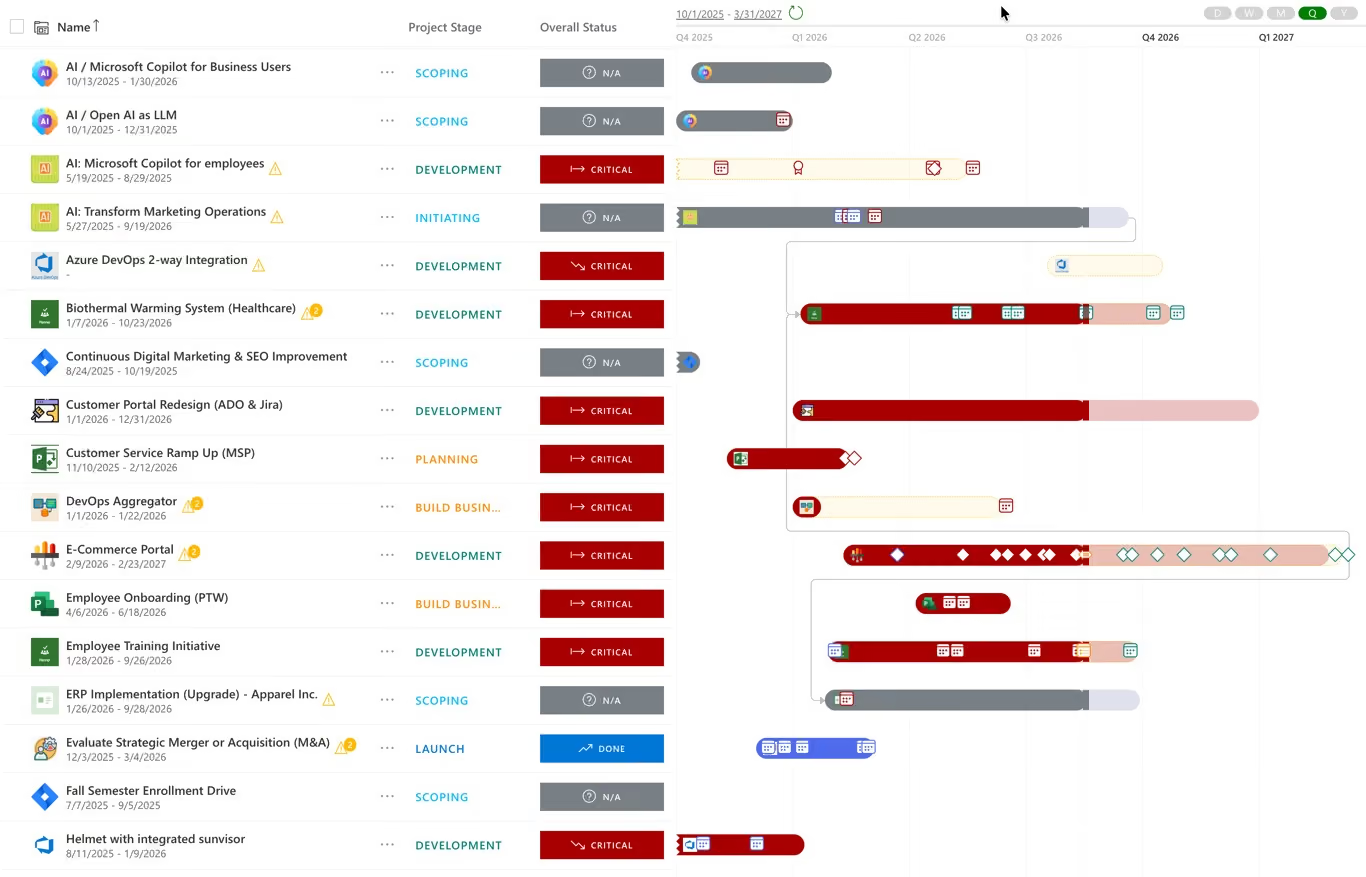
Roll up work from Azure DevOps, Jira, Microsoft Project, Planner, Project for the Web, Smartsheet and Monday.com, alongside development and manufacturing programmes entered directly. Functions keep their delivery tools. The portfolio committee gets one current view without a data call before every review.
A configurable process of phases and stages with gates between them, and you choose which gates require approval. Assigned approvers review in the Approval Center and all must approve before a programme advances, so a gate decision is a recorded, comparable event rather than a meeting outcome.
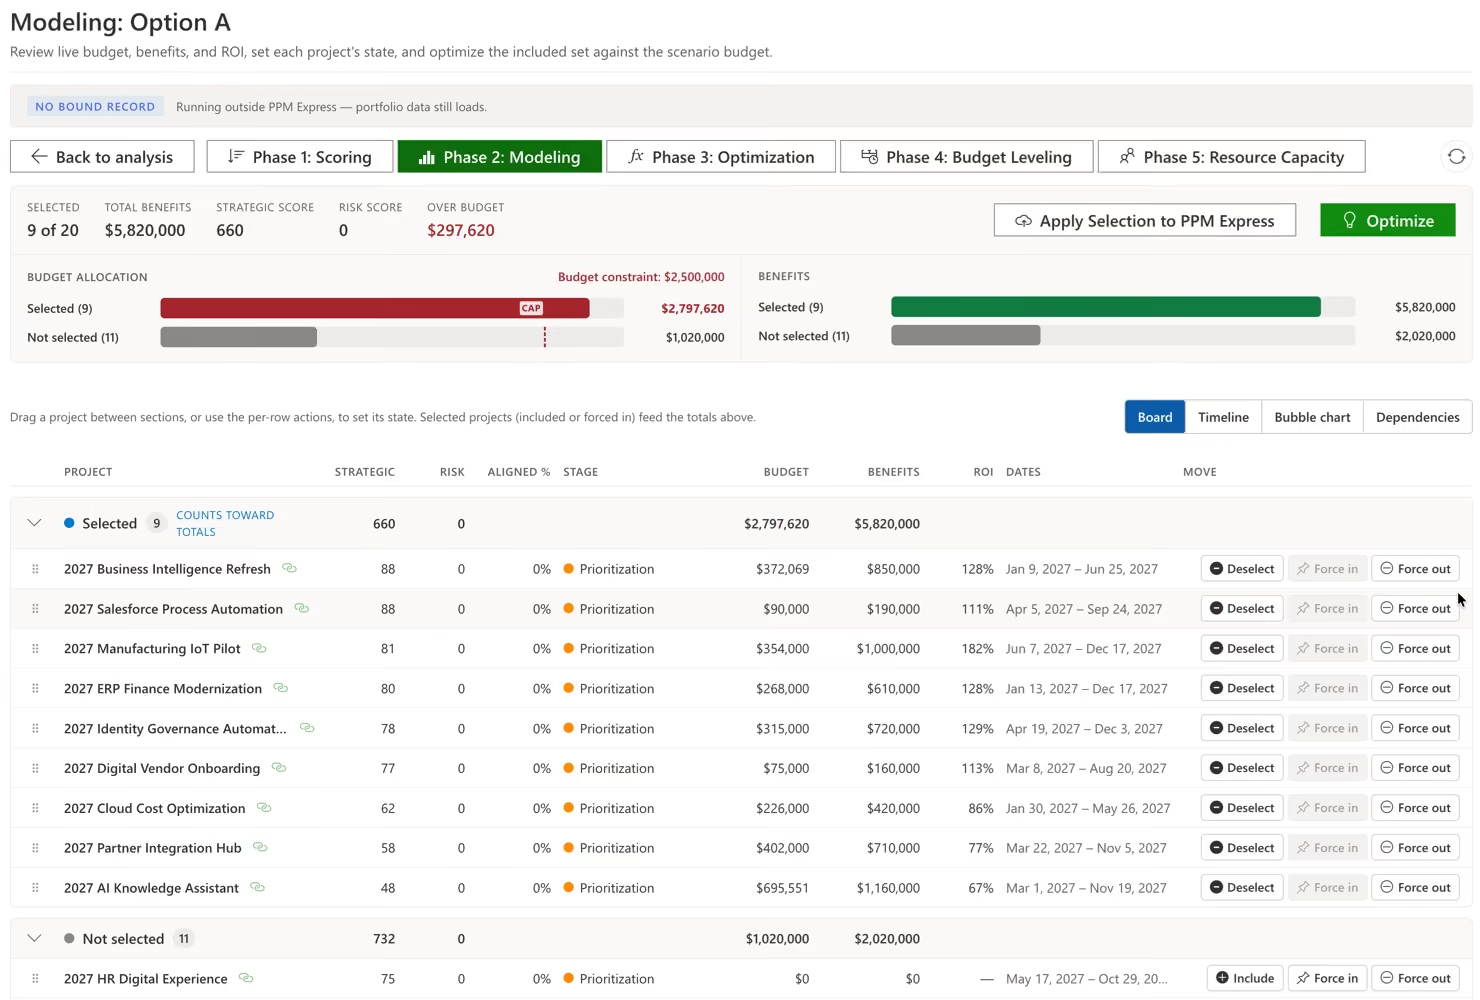
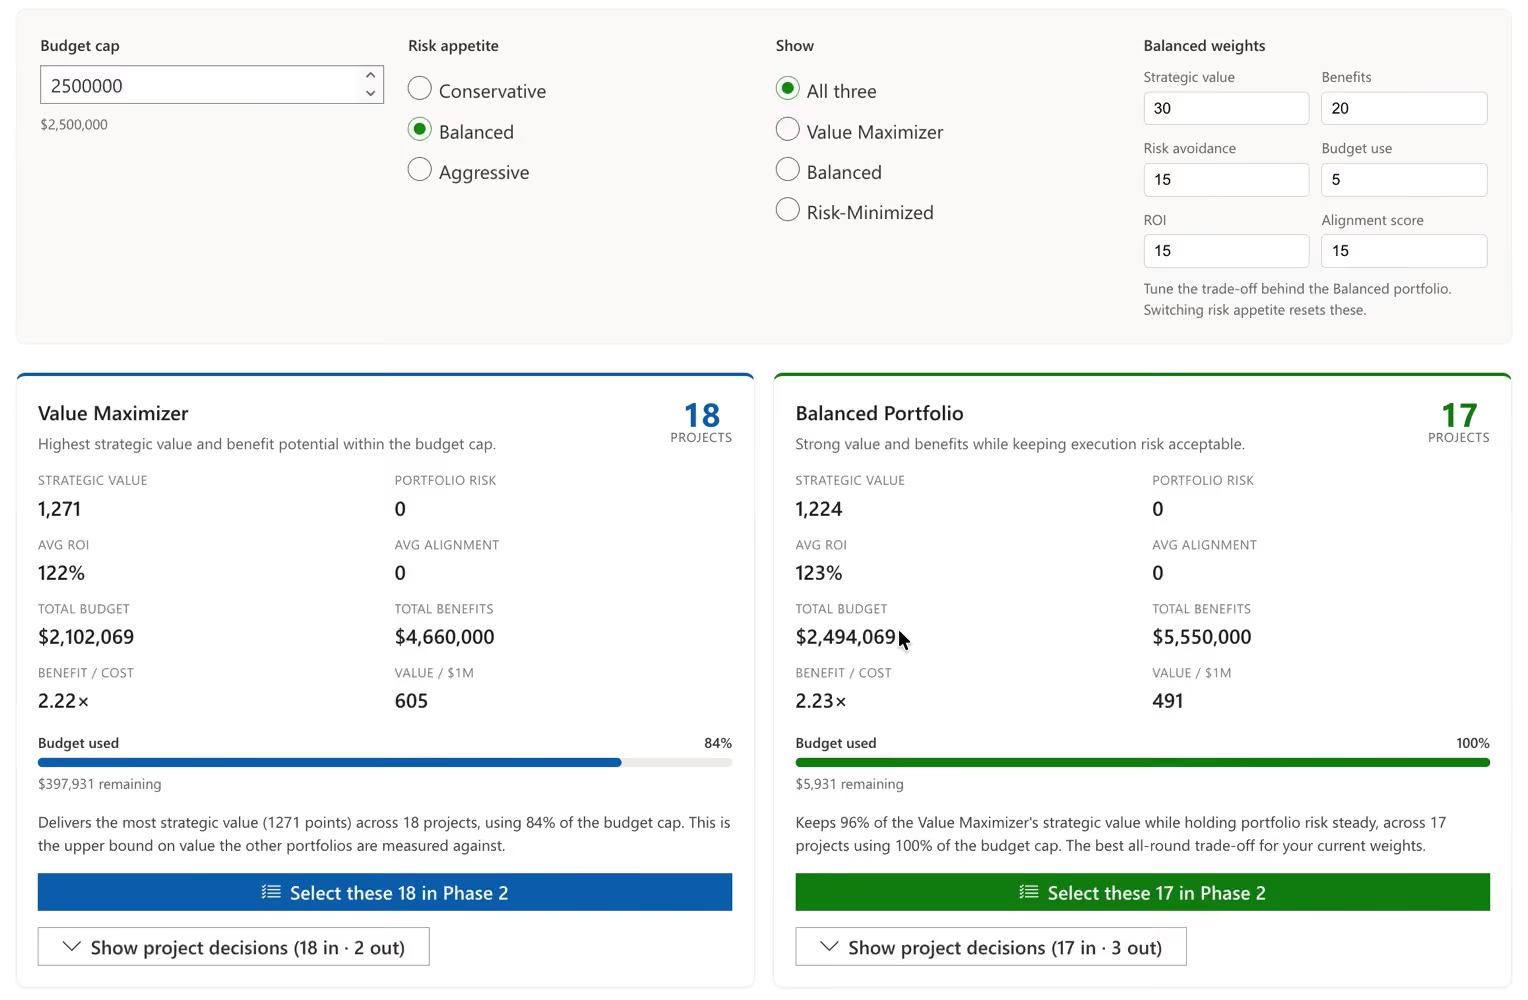
Model funding scenarios against one ceiling and test the selected programmes against availability in hours or % FTE. Where three programmes assume the same regulatory, biostatistics or validation capacity in the same quarter, you see the collision while it is still a plan.
Enterprise PPM platforms cover broadly the same ground. Where they differ most is what it costs to give your whole organization access to it.
| PPM Express | Planview | Planisware | Meisterplan | ServiceNow SPM | |
|---|---|---|---|---|---|
| Portfolio and programme hierarchy | Yes | Yes | Yes | Yes | Yes |
| Weighted scoring and prioritization | Yes | Yes | Yes | Yes | Yes |
| What-if funding scenarios | Yes | Yes | Yes | Yes | Yes |
| Resource capacity planning | Yes | Yes | Yes | Yes | Yes |
| Stage-gate intake and approvals | Yes | Yes | Yes | Yes | Yes |
| Budgets, forecasts and benefit realization | Yes | Yes | Yes | Yes | Yes |
| Dashboards and portfolio reporting | Yes | Yes | Yes | Yes | Yes |
| Specialist function capacity pooling | Yes | Yes | Yes | Yes | Limited |
| R&D pipeline valuation modelling | Limited | Limited | Deepest | No | No |
| Microsoft Project, Planner and Project for the Web | Native two-way | Yes | Limited | Limited | Limited |
| Jira and Azure DevOps | Native two-way | Yes | Limited | Limited | Yes |
| Power BI reporting pack | 200+ reports | Limited | Limited | Limited | Limited |
| Unlimited users included | Yes | No, per seat | No, per seat | No, per seat | No, per seat |
| Typical annual cost | $8,000 to $25,000 flat | $100,000+ | $100,000+ | Mid five figures | $100,000+ with platform |
Planisware is the credible incumbent in life sciences R&D portfolio management, and genuinely deeper than we are on pipeline valuation, probability-weighted modelling and NPD-specific stage-gate structures. If your portfolio is predominantly discovery and clinical development and pipeline modelling is the primary requirement, evaluate it seriously. We would rather you knew that from us. Where organizations move away from it is when the portfolio is mixed: R&D alongside manufacturing, quality, commercial and IT work, where the R&D depth is largely unused and still paid for.
Planview is the broadest suite in the category and the strongest analyst position. If you need enterprise architecture, value stream management and PPM from one vendor, it covers more ground than we do, with the longest implementation and highest cost to match.
Meisterplan is fast to deploy and very good at lean capacity and scenario planning. If contention over regulatory and biostatistics capacity is your single problem, it will solve it quickly. It is deliberately lighter on financials, benefit realization and gated intake, which is where life sciences governance requirements usually push organizations past it.
ServiceNow SPM is a strong choice if you already run ServiceNow for ITSM. If not, you are buying the platform to get the portfolio module, and it is the weakest of the four on R&D-specific governance.
PPM Express covers the same core portfolio capabilities on one flat annual subscription with unlimited users. We are not the deepest R&D pipeline tool. Planisware is. We are the portfolio layer for life sciences organizations governing R&D alongside technical operations, quality and IT, on Microsoft and Jira, without a six-figure licence.
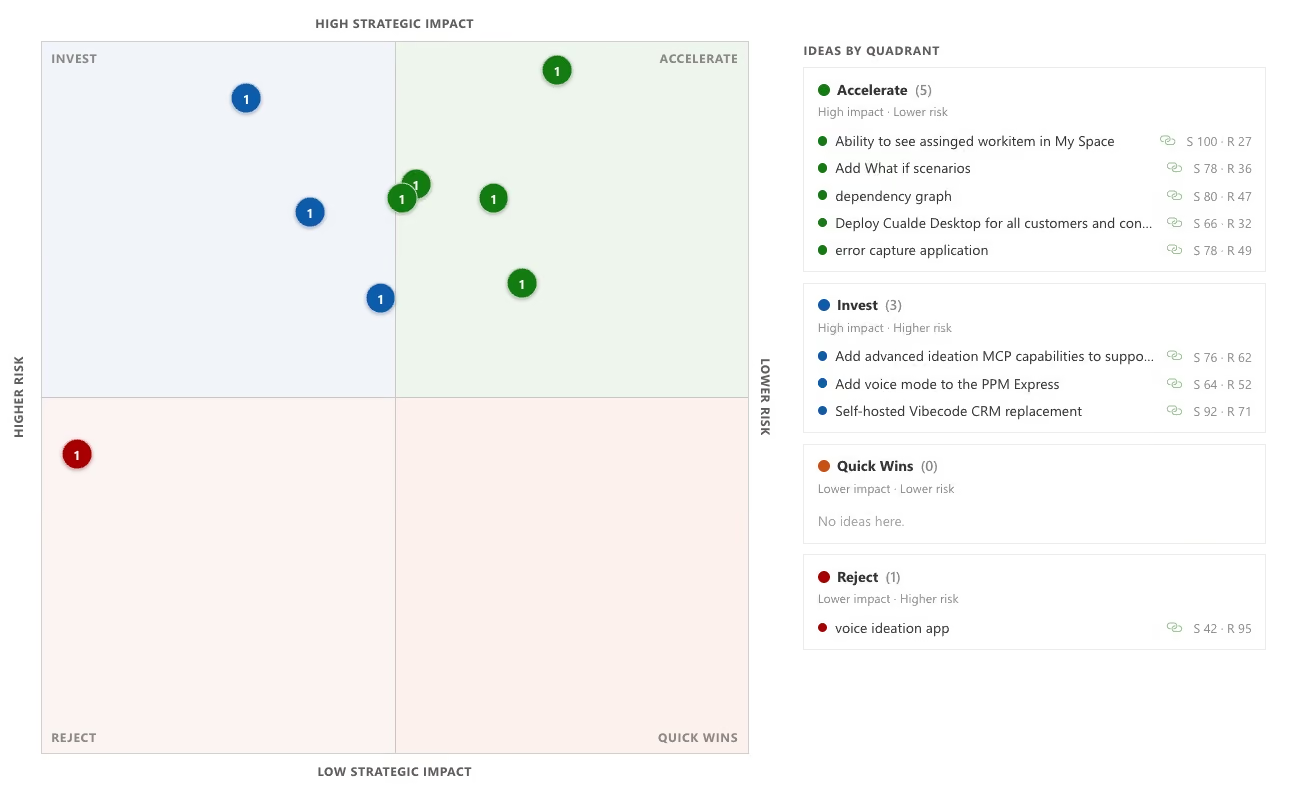
A phase transition, a manufacturing scale-up, a quality remediation and a data platform programme can all be justified and still compete for the same specialists. Score each against explicit criteria, compare the scenarios that are genuinely fundable, and test against capacity before four plans become one impossible development calendar.

Security & Trust
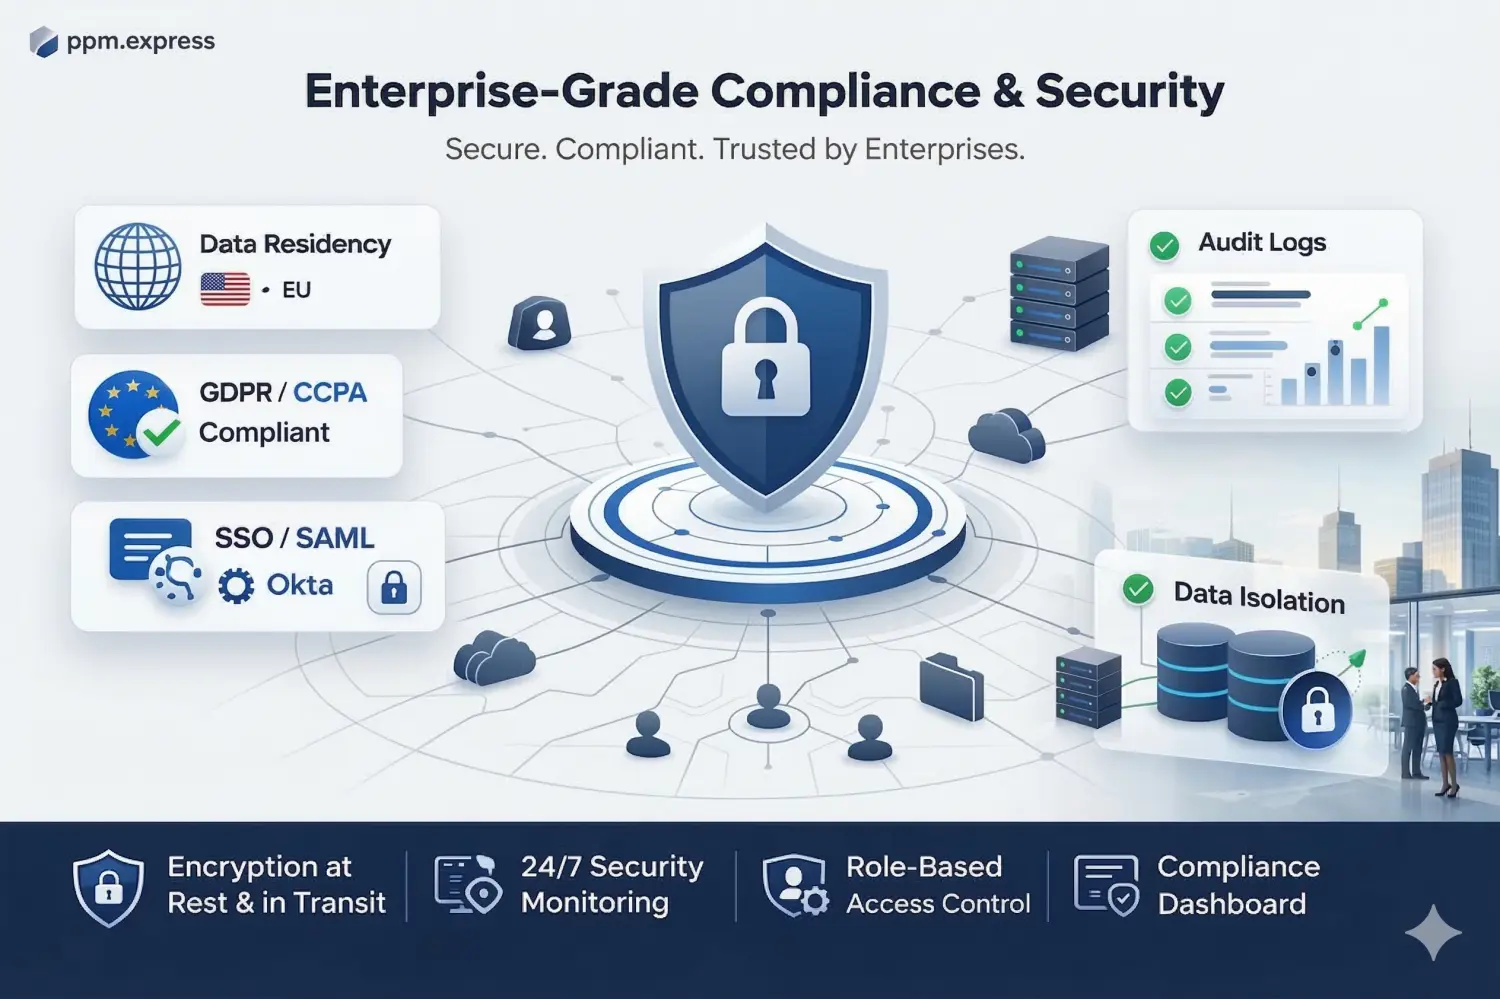
Enterprise-grade security is built into our platform. We offer US and EU data residency, full GDPR compliance, and custom DPAs to meet strict regulatory requirements.
Need app availability in your region/country to meet data residency requirements? We can provide.
Microsoft 365 and Okta SSO ensure secure identity management, while centralized user management, advanced permissions, detailed audit logs, and strict data isolation protect sensitive enterprise data.
Bring your security reviewers to the same call.
Book Enterprise Demo

What our clients say
250+
Customers
use our software daily
100 hours
Saved every year
on monitoring state and statuses of projects, per PM
100K+
Projects
tracked on the PPM Express platform
Unlimited
Users
on every paid plan, so visibility is never rationed
Data residency
US & EU Data Residency
Encrypted in transit and at rest, with SSO, audit logs and tenant isolation. No customer data used to train AI models.
Reporting
200+ ready-to-use reports
Power BI reports built on live portfolio data, so stakeholders get self-service dashboards instead of a request queue.
Pricing
One flat annual subscription
$25,000/year for large enterprises, $8,000/year for SMB. No per-seat penalty.

Streamline Project Portfolio Management and Visibility at Scale
Integrations

Capture new project request, streamline evaluation and prioritization
Product

Structured Approach for prioritizing and aligning portfolios with strategic priorities and resource constraints
Product
Last updated 7 September 2026
Life sciences portfolio management, answered.
Managing R&D, clinical development, manufacturing, quality and IT initiatives as one funded portfolio rather than as separate functional plans. Life sciences organizations need it for a structural reason: programmes are planned by therapeutic area or function but delivered by shared specialist groups — regulatory affairs, biostatistics, data management, validation — so plans that each look achievable produce a capacity collision that only appears near a milestone.
It depends on what you are governing. If the requirement is trial operations — site management, monitoring, subject data — that is a CTMS, and a general portfolio tool is the wrong category entirely. If the requirement is portfolio governance across R&D, technical operations, quality and IT, the question becomes stage-gate support, cross-programme capacity visibility and a defensible decision record. Planisware is the deepest option where R&D pipeline valuation dominates. PPM Express is built for mixed portfolios and adds a portfolio layer over Microsoft 365, Project, Planner, Azure DevOps and Jira rather than replacing the tools functions already run on.
PPM Express is positioned as a portfolio governance layer, not a validated system of record for GxP data. Your quality organization should confirm what that means for your intended use before deployment.
Each programme runs a configurable process of phases and stages with gates between them, and you select which gates require approval. Assigned approvers review in the Approval Center, and every one must approve before the programme advances. Reviewers typically weigh value, risk, schedule, budget, resources and what was actually delivered in the prior phase.
Put it in the same portfolio as everything else, scored on the same model, drawing from the same capacity pool. Organizations often govern the lead programme separately because of its size, and that is precisely what hides its true cost: the earlier-stage and technical operations work that quietly never happened because the same specialists were committed elsewhere.
Not on the same absolute value, but on the same scale. Published value ranges on weighted strategic and risk factors mean a risk score carries the same meaning wherever it is entered. Running a second, lighter framework alongside the weighted model and examining the disagreements is often more informative than either result alone.
Re-test the portfolio at each funding cycle instead of treating the original approval as settled. Baselines set at the initial decision stay available, so the committee can see how far the current forecast has drifted from the case it approved. On a multi-year asset that is the single most useful governance question, and the one least often asked.
Allocation shows against calculated capacity in hours, percent or FTE, with overallocation flagged before anyone commits. In practice this surfaces the shared regulatory, biostatistics, data management and validation specialists who appear in several programme plans at once. Each plan looked entirely plausible on its own, which is why the clash never gets caught in a programme-level review.
Yes. Resources are filtered by role, department or skill, with utilization in hours, percent, FTE or chart view. Capacity is calculated from each person's work week and calendar exceptions, and actual hours from time tracking feed the same views. This is usually the first thing that surprises portfolio leaders: the shared functions are committed well past capacity while every individual programme plan looked reasonable.
Yes. Project Online and Project for the Web connect directly. For plans built in the Microsoft Project Desktop client, PPM Express Project Publisher is an add-in that publishes an open schedule up into PPM Express. Desktop 2016, 2019 and 2021 are supported, and each published plan carries up to 2,000 tasks across ten levels of hierarchy.
Yes. An analysis owns the budget ceiling, the scoring model and the candidate programmes, and scenarios inside it are judged by the same rules. When a readout or regulatory outcome changes an assumption, you re-cut the portfolio against the new reality and compare it against the previously selected scenario, with the original baseline retained.
The retained decision history shows which scenario was selected, on which model, with which numbers at that moment. Models scoring live programmes must be cloned before editing, so an earlier decision basis cannot be silently altered. Detailed audit logs, data residency options and custom DPAs cover the standard requests.
Budget, forecast, benefits and impact are tracked against the programme and baselined at each funding decision, so drift between the current forecast and the approved case is visible rather than reconstructed. Most portfolio reviews compare current forecast to last quarter's forecast, which hides cumulative drift entirely.
.svg)


